Building web application dashboards
(and dashboard applications)
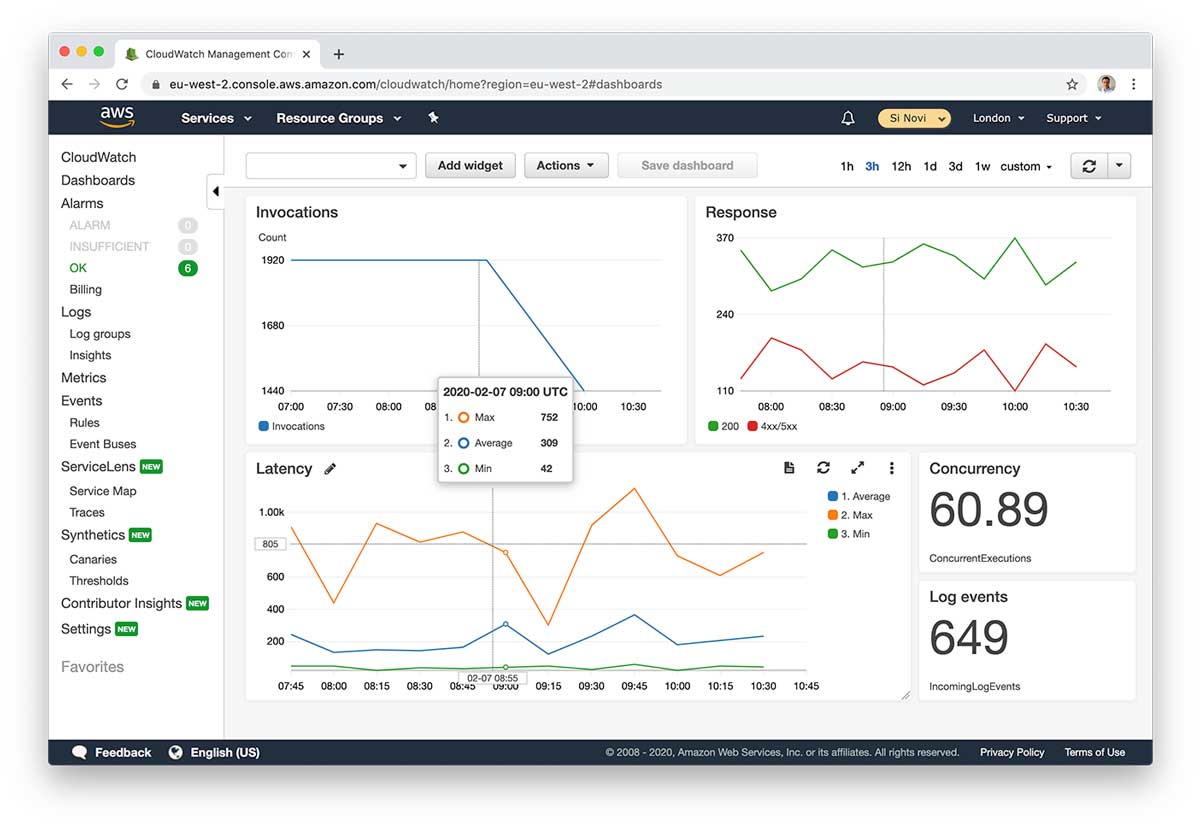
The cloud-based applications we build often require logging and monitoring in order to understand their operational patterns, and to debug and identify anomalies. Therefore we regularly construct CloudWatch dashboards which present useful data so that we can observe the activity of an application.
But we also develop dashboard applications in their own right. We've been commissioned many times in the past to produce an application whose purpose is to provide data insights and oversight of vital business service or system metrics. These applications typically contain ways to filter data, choose date ranges and drill down into further detail.
For both requirements, we're finding we're developing more and more dashboard reporting directly into AWS by using CloudWatch and its rich feature set.

We've used a wide variety of technologies to build dashboard applications over the years; JavaScript charting tools like Chart.js or Highcharts or data visualisation tools like Kibana, and we've embedded and integrated these tools into a web application in a LAMP stack or front-end driven React app.
But with more of our development being cloud-native within AWS, and much of our systems being developed as serverless applications built using Lambda functions, we find that CloudWatch is the perfect tool.
Why would you choose CloudWatch?
Firstly, because of the seamless integration with AWS Serverless components like Lambda, where logs are streamed into CloudWatch and can be parsed, queried and aggregated within AWS's ecosystem.
We find one of the greatest benefits is that of speed of development - it's so easy to construct charts and dashboards to rapidly test and validate ideas, and optimise the data that is being logged. We can iteratively develop a dashboard of metrics which can be experimented with before honing in on the final design to be used ongoing. This gives us the opportunity to share data with the client or end-user and collaboratively agree the goals, without needing a big investment up-front. We often find the dashboard that's been developed as a proof-of-concept becomes the de facto dashboard used for some time.
Of course, there are limitations and there would be many reasons why a custom-built reporting application would be a superior choice. The first being access control and the client or end-user's comfort level with using AWS and CloudWatch - within a bespoke React application it's possible to provide a far superior user experience for login and navigation, particular for users unfamiliar with Cloud service consoles like AWS or Google Cloud. But moving onto the development of a besoke dashboard application is easier and delivers better value if you have established a prototype in CloudWatch beforehand.
A useful intermediate solution is to embed a CloudWatch snapshot chart into an external webpage, which allows you to leverage the power and close AWS service integration of CloudWatch while keeping your users in an environment that you control.

Ways to present data in CloudWatch
There are numerous ways to bring data into a CloudWatch dashboard, these are some of the methods we use when working on AWS development projects.
CloudWatch Insights Queries
The Insights interface allows for complex queries to be written using AWS's own Insight Query Language. You can use these queries to parse the CloudWatch Logs, filtering log records and aggregating numerical data. Furthermore CloudWatch's ability to parse JSON within a log record means you can query on and select nested object properties
An example Insight Query:
filter @type = "REPORT"
| stats avg(@duration), max(@duration), min(@duration) by bin(5m)
CloudWatch Log Metric Filters
This a neat feature which allows you to match text strings within a log record and aggregate their occurences. This means you can set up your Lambda functions to log specific strings, which can then be identified and pulled out as custom CloudWatch Metrics. The Metrics can then be used to create charts or number widgets for your dashboard.
Metric Widgets
CloudWatch allows you to select from a huge range of built-in metrics from many of the AWS services, such as EC2 instance utlisation, S3 storage and Lambda invocation and duration.
Custom metrics can also be created so that you can pass your own values into CloudWatch from services like Lambda.
Both the standard and custom metrics can then be used to create charts and visualisations of the data.
Summary
AWS CloudWatch has become an integral part of our AWS Development patterns. As we tackle each invidual project going forward, we'll establish whether we use CloudWatch purely for monitoring an application, or if it's suitable to deliver the application functionality in its own right. These decisions will always be based on the specific needs of the client, the project and the outcomes we're looking to achieve together - but also by our knowledge and experience of the rich features and value of CloudWatch as an effective ready-made dashboard reporting tool.


